
How to Install Metricbeat Using Docker
1. Introduction
Metricbeat is a Lightweight shipper that can help you collect metrics from servers and services running on those servers. The tool is part of the Elastic Beats family and can be installed as an agent on your servers. Metricbeat can output its data directly to Elasticsearch or Logstash for further processing. This tutorial teaches you how to install and configure Metricbeat to monitor a MySQL server running in a different Docker Container.
2. Prerequisites
- You are expected to have basic knowledge of Docker. This tutorial uses Docker Desktop for Windows, but you can use any other Docker installation depending on your Operating System. Moving forward, we will assume that you have a working installation of Docker in your workstation.
- Metricbeat will be sending its data to Elasticsearch and Kibana. Ensure you have them up and running. For an easy setup, you can follow this tutorial to configure them at once using Docker-compose.
3. Directory Structure
First things first. Let’s start by creating a directory metricbeat where we will keep the Metricbeat configuration file and any other file related to the installation.
C:\apps\metricbeat>tree /f
Folder PATH listing for volume Windows
Volume serial number is xxx-xxx
C:.
└───config
        metricbeat.yml
- metricbeat.yml is the Metricbeat configuration file. You can create an empty file for now.
4. Metricbeat Configuration file metricbeat.yml
Metricbeat requires a configuration file in YAML format.
Let's create the file and save it under "C:\apps\metricbeat\config\metricbeat.yml", with the following content:
# metricbeat configuration file
metricbeat.modules:
- module: mysql
  metricsets:
    - status
    - performance
  hosts: ["tcp(mysql-container:3306)/"]
  username: root
  password: ${MYSQL_ROOT_PASSWORD}
  period: 10s

output.elasticsearch:
  hosts: ["http://elasticsearch:9200"]

setup.kibana:
  host: "http://kibana:5601"

setup.dashboards.enabled: true

logging.level: debug
- We need to activate the mysql module to monitor a MySQL Server. The module requires several parameters: the list of metricsets, the server's URL and the credentials, and the periodicity to fetch the data.
- The output is of type elasticsearch. This allows Metricbeat to send the input content directly to an Elasticsearch backend. The data will be sent to the default index
metricbeat-*. You may only specify one single output in a config file. You can find the full list of Metricbeat output types here. - We also configured Kibana so that Metricbeat will automatically load the default Dashboards.
5. Configure the MySQL Server Container
Since we will monitor a MySQL Server, let's start a container with MySQL version 9.0.1.
docker run --name=mysql-container --network=elk_elk -p 3306:3306 -it -e MYSQL_ROOT_PASSWORD=%MYSQL_ROOT_PASSWORD% mysql:9.0.1
--name mysql-container: the name we are giving to the container. This name will be used by Metricbeat to access MySQL.-e MYSQL_ROOT_PASSWORD=%MYSQL_ROOT_PASSWORD%: A root password is required by the image. We have created the password as a Windows environment variable.--network=elk_elk: Our ELK Stack (Elasticsearch and Kibana) is running on a Network called "elk_elk". Adjust it depending on your setup.
6. Configure the Metricbeat Container
Once MySQL has started, use the following command to start the Metricbeat container:
docker run --name=metricbeat -h metricbeat --network=elk_elk -it -m 1GB -e MYSQL_ROOT_PASSWORD=%MYSQL_ROOT_PASSWORD% -v "C:/apps/metricbeat/config/metricbeat.yml:/usr/share/metricbeat/metricbeat.yml:ro" docker.elastic.co/beats/metricbeat:8.15.0 metricbeat -e
--name metricbeat: the name we are giving to the container-h metricbeat: the hostname of the docker container--net elk_elk: to specify the network to which the container is attached-m 1GB: to limit the memory size-v ...: to bind a directory in the host machine to a directory in the container. We use it to pass the configuration file from our host machine to the container.metricbeat -e: this instructs Metricbeat to redirect its logs to the console instead of writing them in a file. This is particularly useful because Metricbeat is running inside a container.
If everything goes well, Metricbeat will start sending MySQL Server metrics to Elasticsearch.
Pro-tip: If you are running Metricbeat on Windows, you may encounter an issue related to file permissions. Simply, ensure the configuration file C:/apps/metricbeat/config/metricbeat.yml is read-only.
7. Verify the installation
To test your setup, you can do any of the following:
Check Metricbeat logs in Docker
docker logs metricbeat
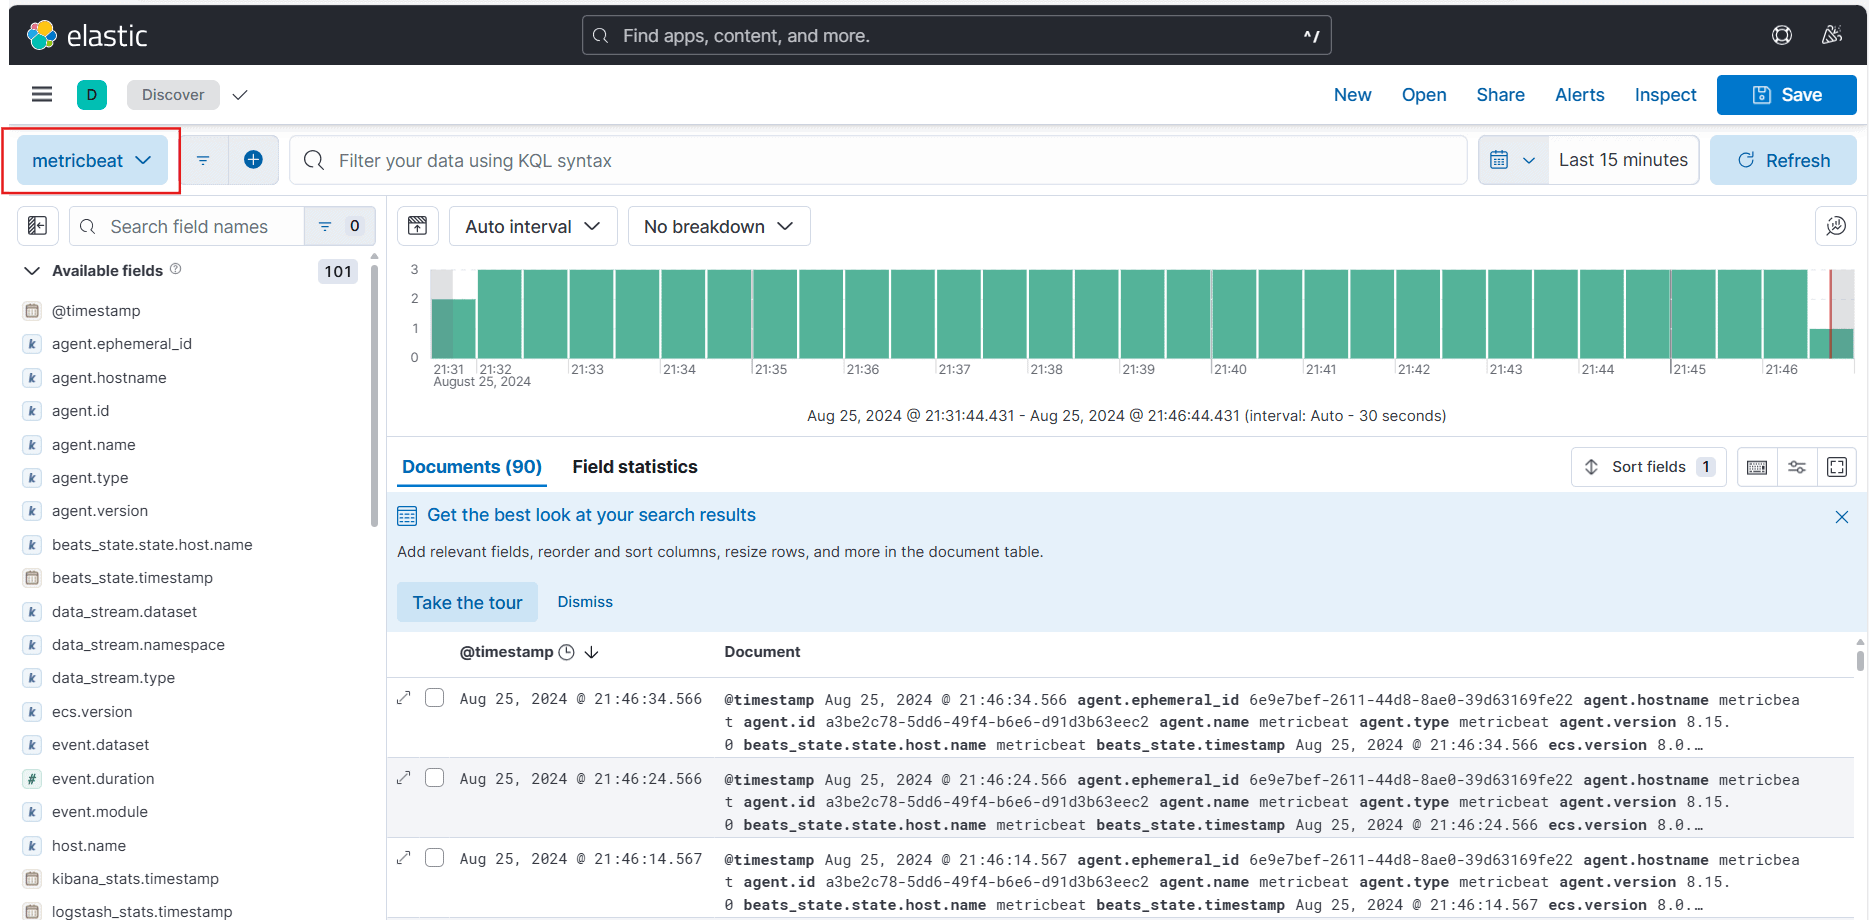
Query the Metricbeat index in Elasticsearch
You can visualize the metricbeat index in Elasticsearch using the Discover Menu in Kibana:
Visualize MySQL Dashboard in Elasticsearch
You can also access the MySQL Dashboard in Kibana by clicking the Burger Menu, then Dashboard:

8. Conclusion
In this tutorial, you learned how to install and configure Metricbeat using Docker.
_This article was originally published at: https://nkamphoa.com