How to Access MQTT Data with ThingsBoard
ThingsBoard is an open-source IoT platform for data collection, processing, visualization and device management. It supports device connectivity via protocols, such as MQTT, CoAP and HTTP, and supports both cloud and private deployments. Deliver, monitor and control your IoT entities in a secure way using rich server-side APIs that define the relationships between your devices, assets, customers, or any other entities. Collect and store telemetry data in a scalable and fault-tolerant manner, visualize your data with built-in or custom widgets and flexible dashboards, and share the Dashboard interface with your customers.
In this article, we will use ThingsBoard Cloud in conjunction with EMQ’s fully managed MQTT cloud service - EMQX Cloud, to describe how to integrate a third-party MQTT broker into ThingsBoard and custom configure the Dashboard UI to access MQTT data.
Preparation
Since we are using ThingsBoard Cloud, we do not need to download and install it. We just need to register and login at https://thingsboard.cloud/signup to get the service. In addition to the ThingsBoard Cloud service, you can also choose to download and install a private deployment.
Note: Only the Professional Edition has platform integration. You need to use ThingsBoard Cloud or download and deploy the Professional Edition.
We will use EMQX Cloud to create a third-party MQTT broker. Sign up for the EMQX Cloud console and create a new deployment. As a new user, you will have a free 14-day trial for both the Standard and Professional plans.
EMQX Cloud Professional edition provides VPC peer-to-peer connectivity and a REST API, and has powerful and flexible data integration capabilities, making it easy for users to interface with their existing cloud service resources. Providing a one-stop operations and monitoring service saves a lot of time and labor costs, allowing businesses to focus on delivering more business value.
Integration
Using EMQX Cloud
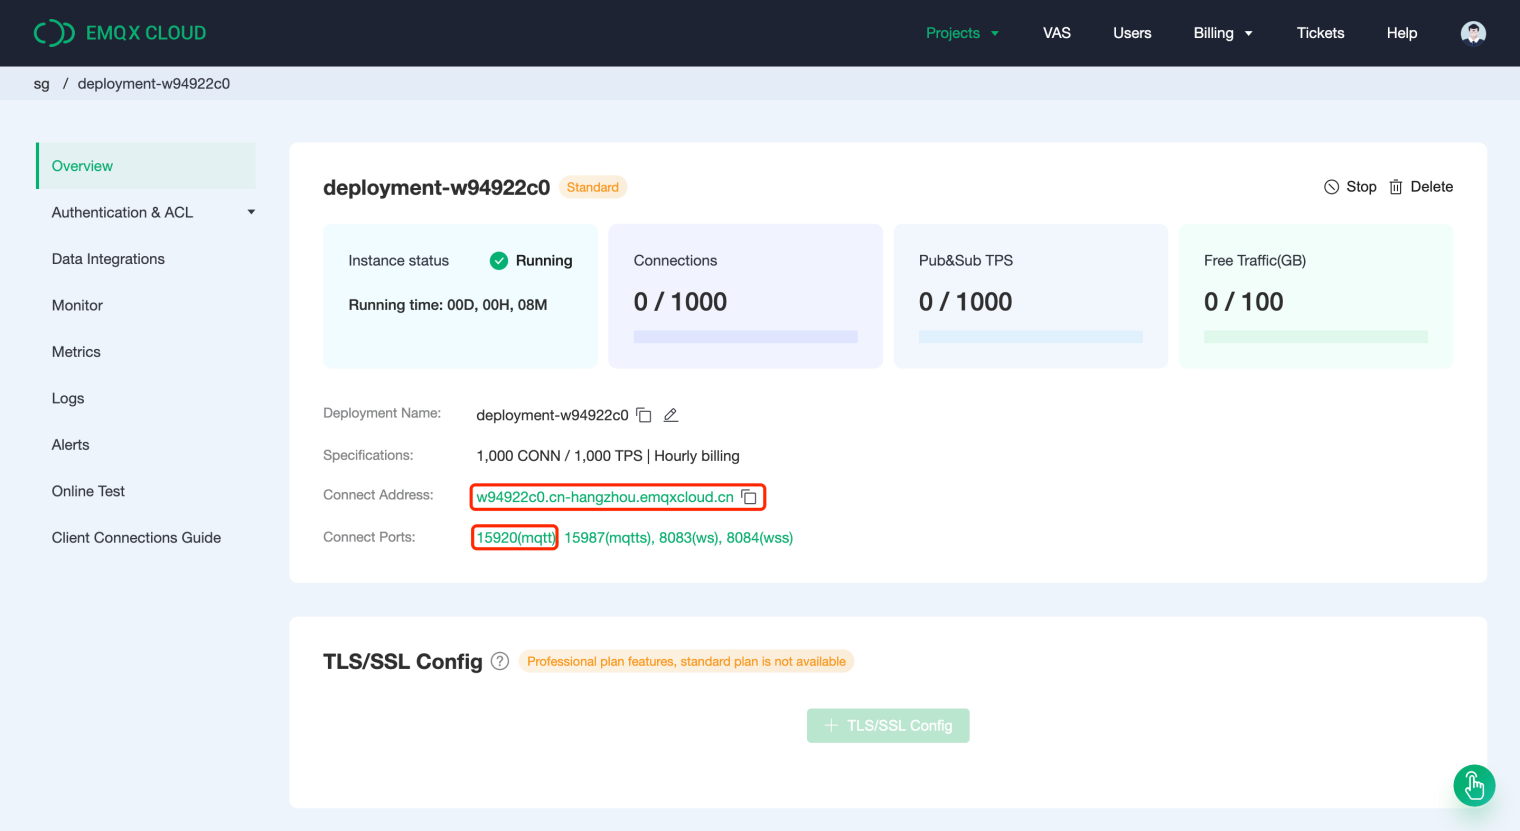
- Get the connection address and port. Wait for the instance status to change to Running on the deployment [Overview] page and find the connection address and connection port corresponding to the MQTT protocol. These are needed later when adding integrations in ThingsBoard.
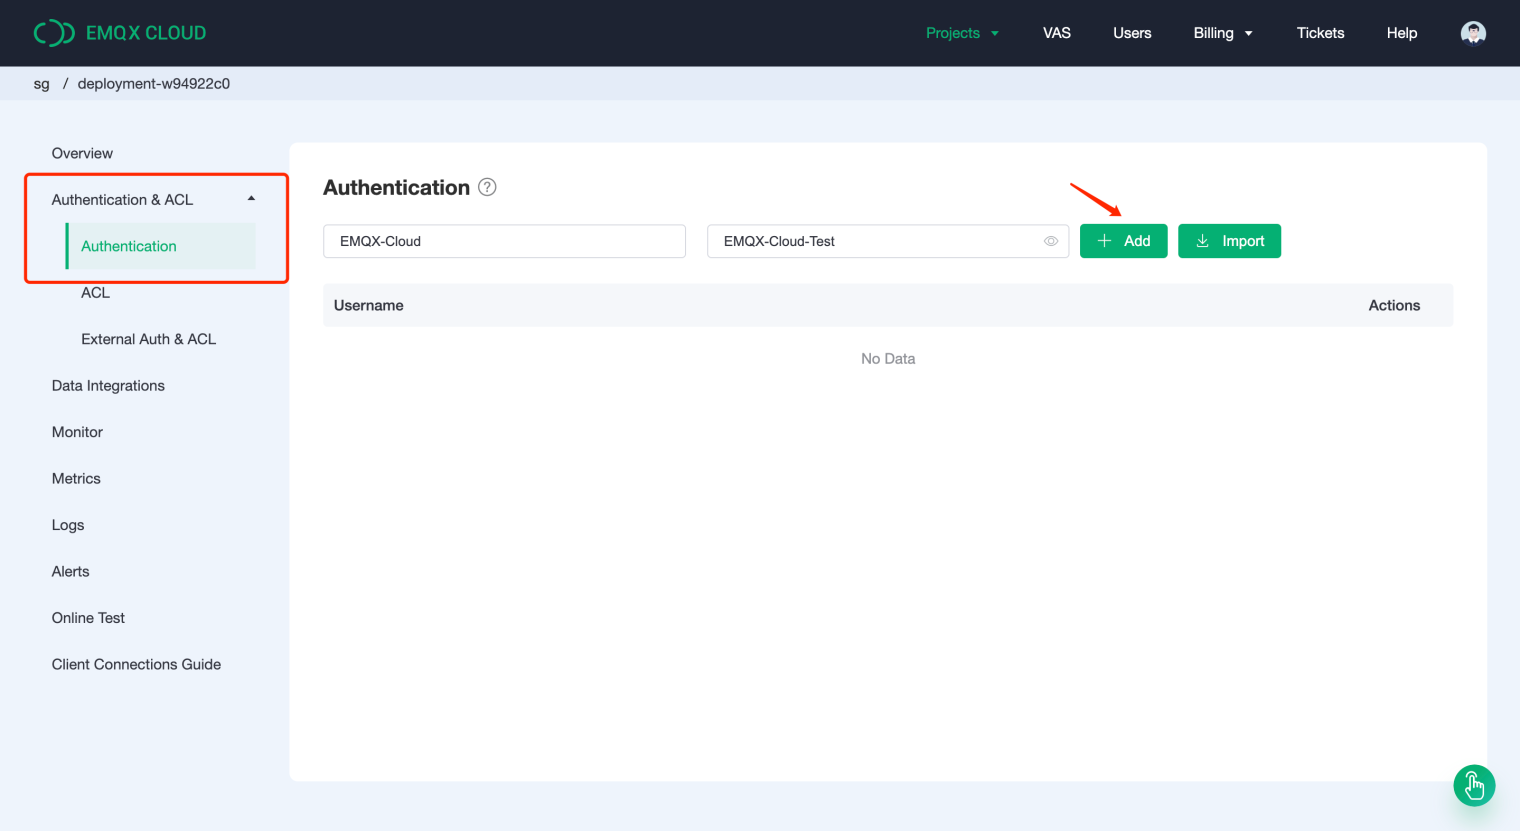
- Add authentication information. Go to [Authentication and ACL] -> [Authentication] to create a username and password that ThingsBoard can use to authenticate with the MQTT broker.
Configure ThingsBoard
- Add a new
Uplinktype data converter in [Data converters]. The role of this uplink data converter is to parse the payload of incoming messages and convert these to the format used by ThingsBoard.
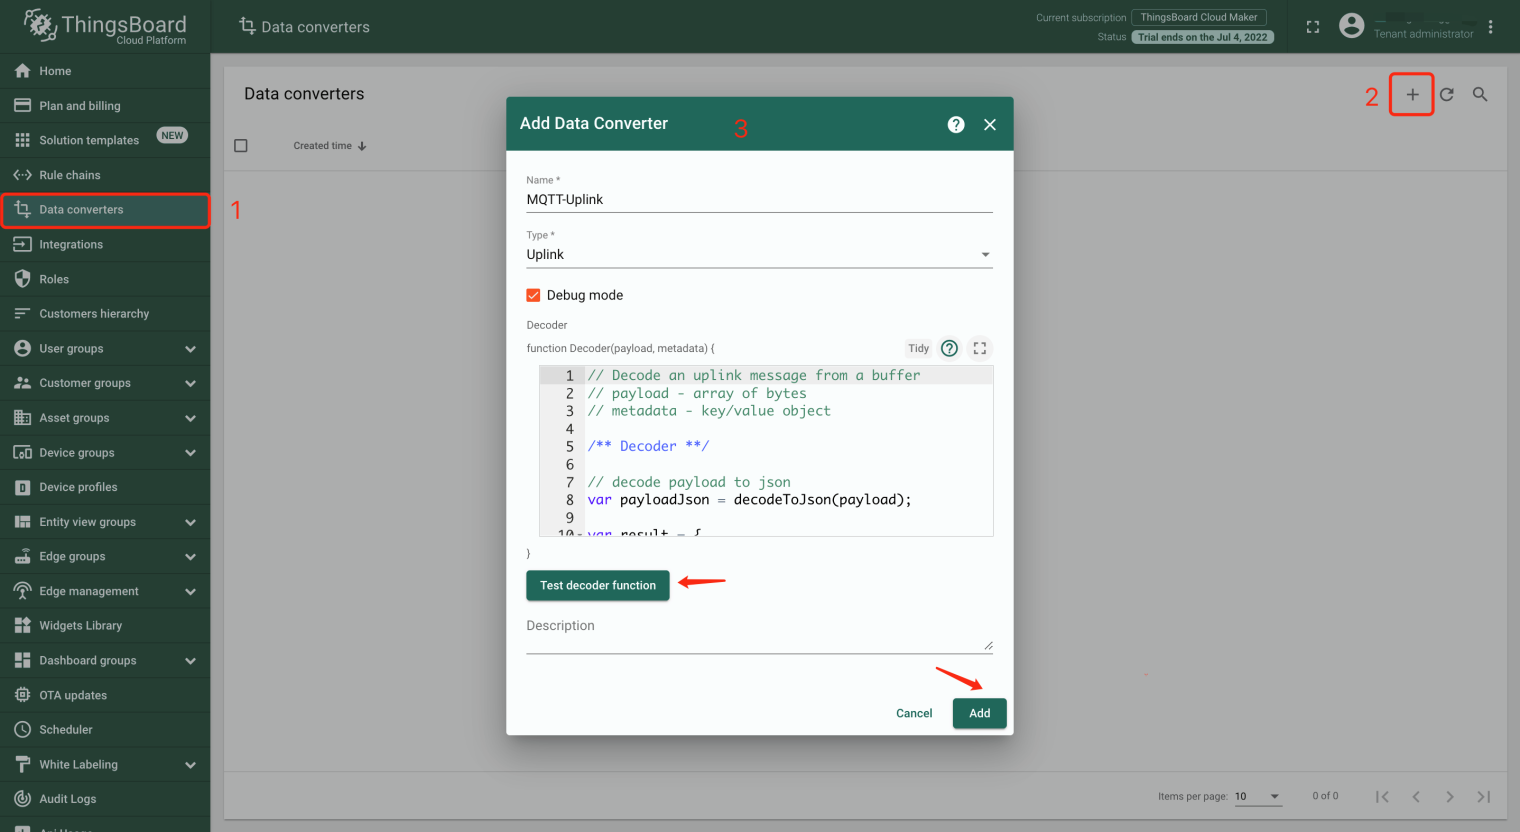
Add Data Converter
1)Enter a name (we’re using the name “MQTT-Uplink” in this example), select Uplink as the type, turn on Debug mode, and copy and paste the following parsing script into the parsing method.
// Decode an uplink message from a buffer
// payload - array of bytes
// metadata - key/value object

// decode payload to json
var payloadJson = decodeToJson(payload);
var result = {
   deviceName: payloadJson.deviceName,
   attributes: {
       model: 'Model A',
       serialNumber: 'SN111',
       integrationName: metadata['integrationName']
   },
   telemetry: {
       temperature: payloadJson.temperature,
       humidity: payloadJson.humidity,
   }
};

// Helper functions
function decodeToString(payload) {
   return String.fromCharCode.apply(String, payload);
}
function decodeToJson(payload) {
   // covert payload to string.
   var str = decodeToString(payload);

   // parse string to JSON
   var data = JSON.parse(str);
   return data;
}

return result;
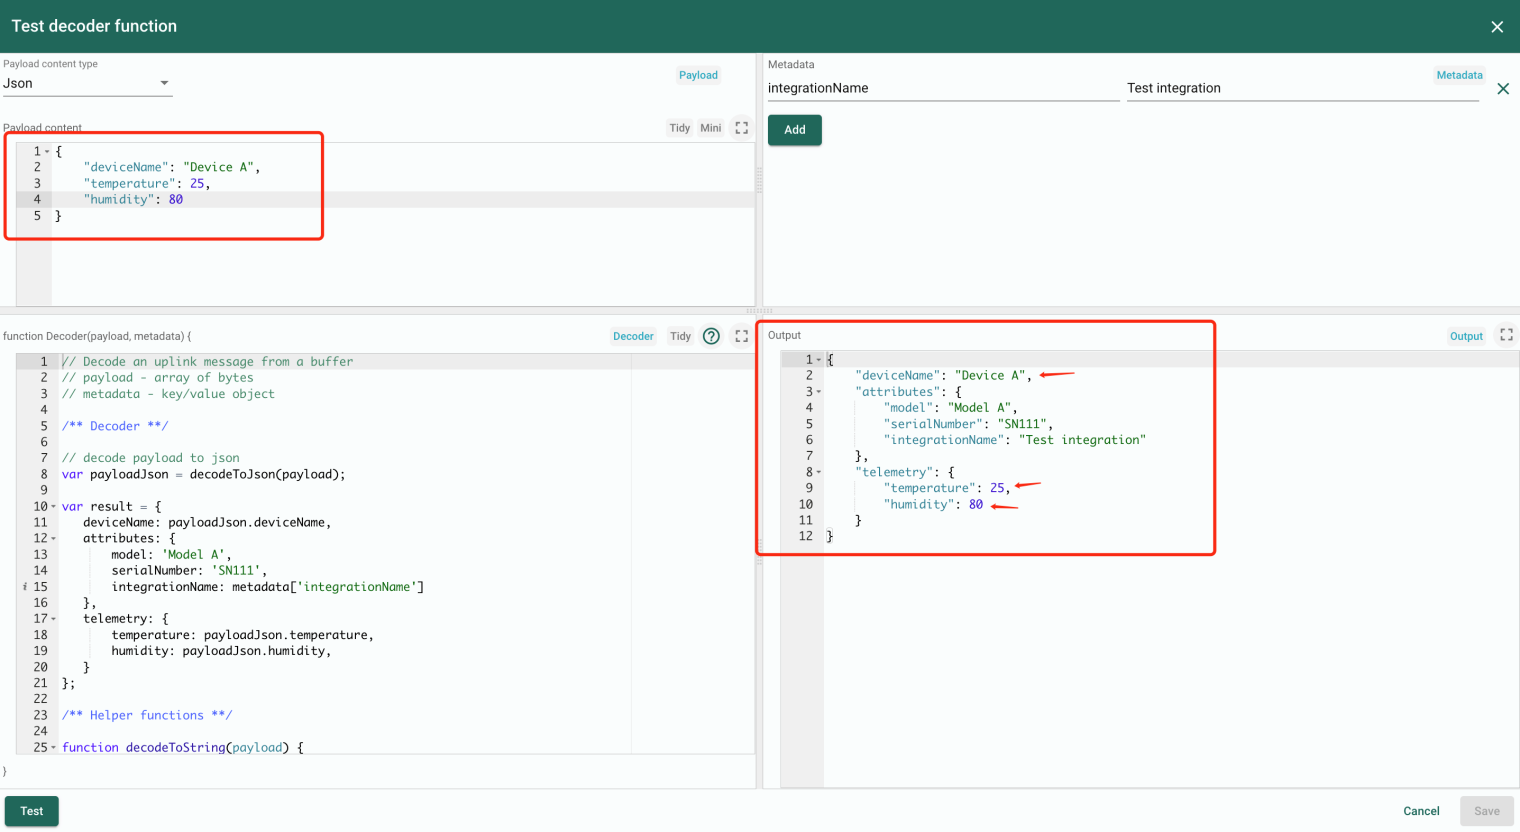
2)Click the [Test decoder function] button to enter a test page and test the parsing script you just created. Enter some payload content in JSON format for the test, and the following test output data will be displayed: input device name, temperature and humidity data. Then, click the Save button to go back to the configuration page.
3)Finally, click the Add button in the bottom right corner of the pop-up box shown in the screenshots “Add Data Converter” above. And then an uplink data converter was successfully added.
- Go to [Integrations] to add the EMQX Cloud deployment integration.
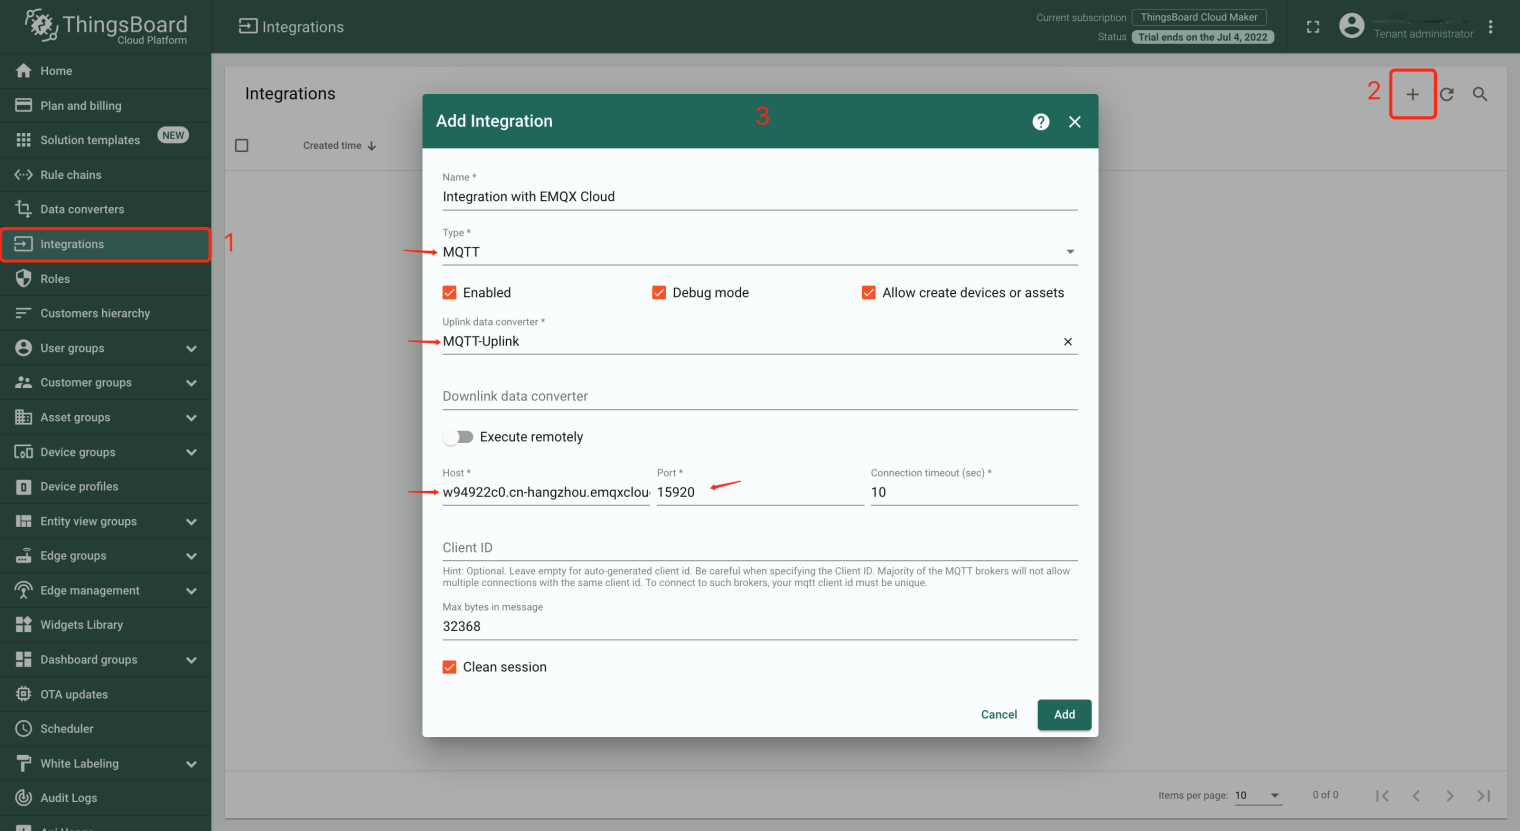
a. Click Add Integration [+], enter a name (“Integration with EMQX Cloud” in this example), set the Type to “MQTT”, and select the uplink data converter MQTT-Uplink that was added in step 1 above. Then, copy and paste the connection address and port number of the MQTT broker from the EMQX Cloud Deployment Overview page.
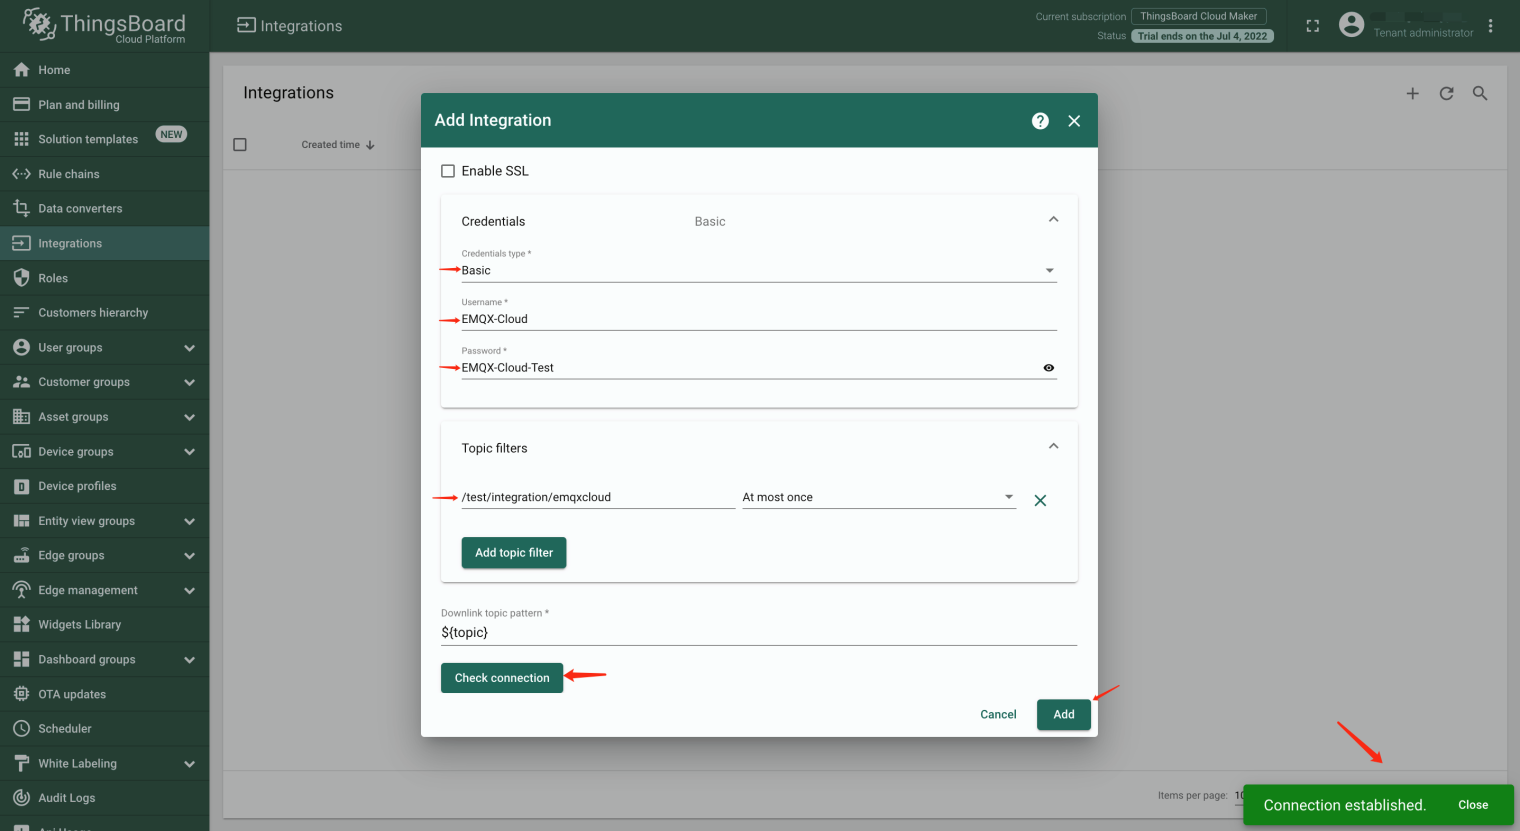
b. Scroll down to add authentication information. Since authentication is enabled by default in all EMQX Cloud deployments, select the Basic credential type and fill in the username and password that were added in the EMQX Cloud Authentication page. Click on Check Connection, and a pop-up message will appear in the bottom right corner, notifying you that the connection has been successfully established. This indicates that the integration with the EMQX Cloud deployment was successful. Finally, enter a filter topic /test/integration/emqxcloud (we need to use this topic to post a message in the subsequent simulation test), and click the Add button to successfully add the integration with the EMQX Cloud deployment.
Integration Test
After completing the above integration configuration, use theMQTT 5.0 client tool, MQTT X, to simulate a device, in order to test and verify the effectiveness of the functionality.
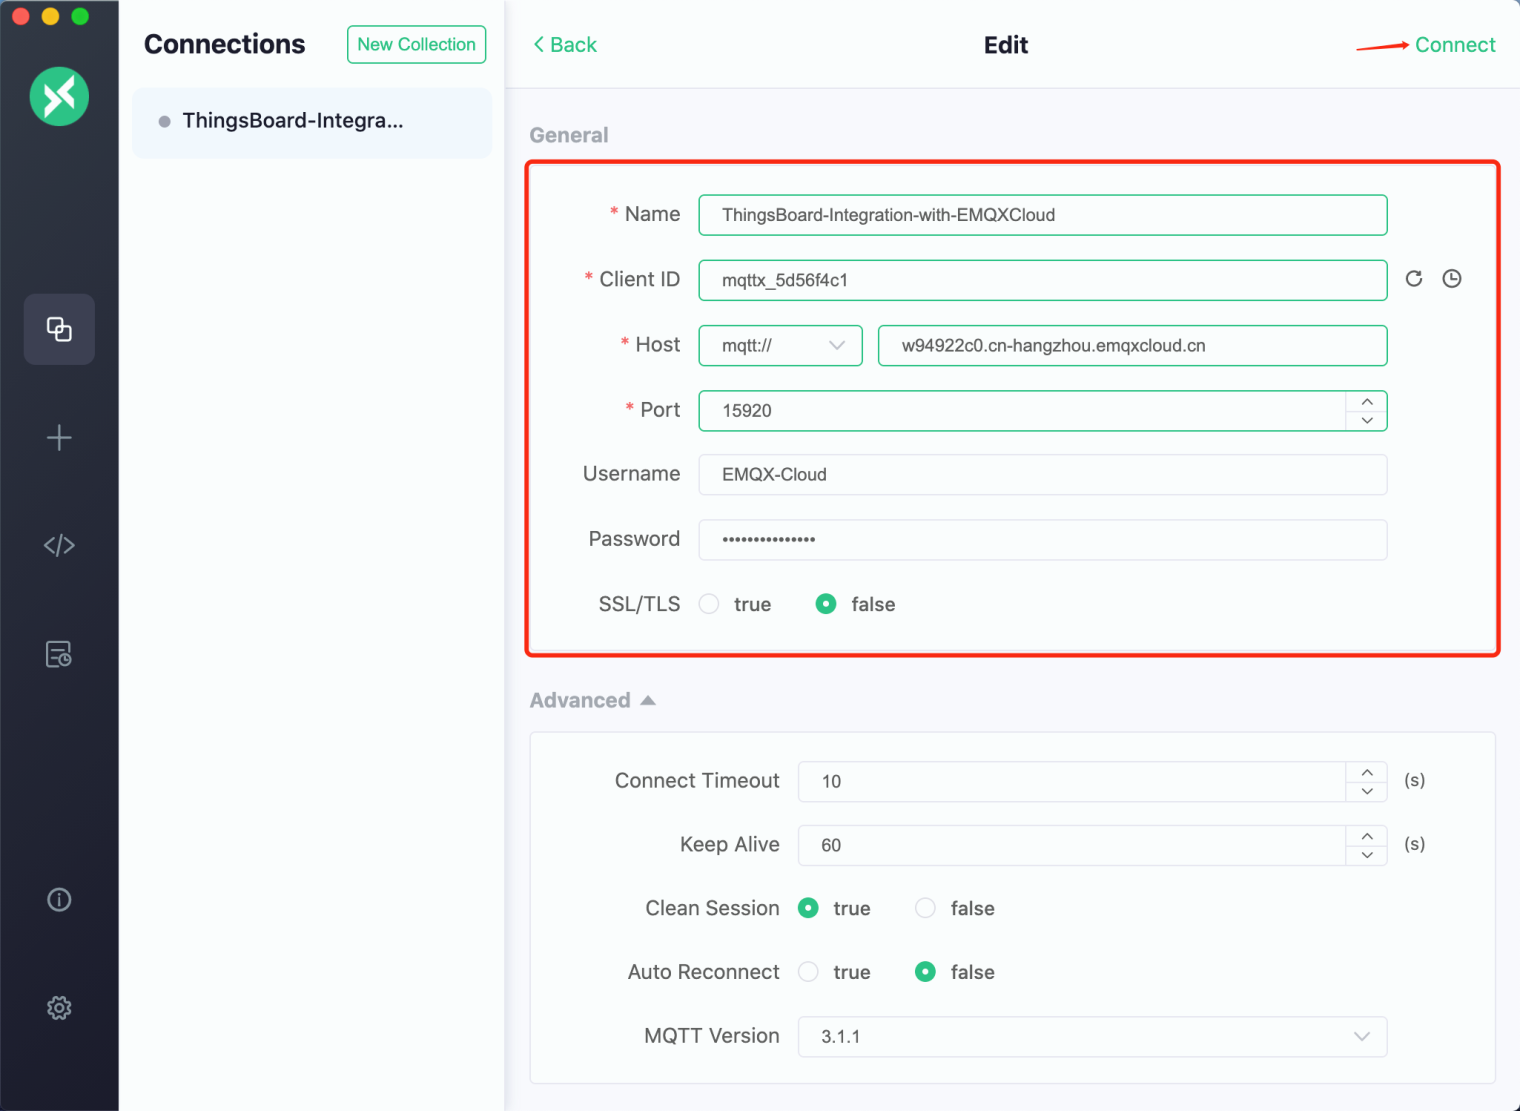
- Use MQTT X to connect to the EMQX Cloud deployment.
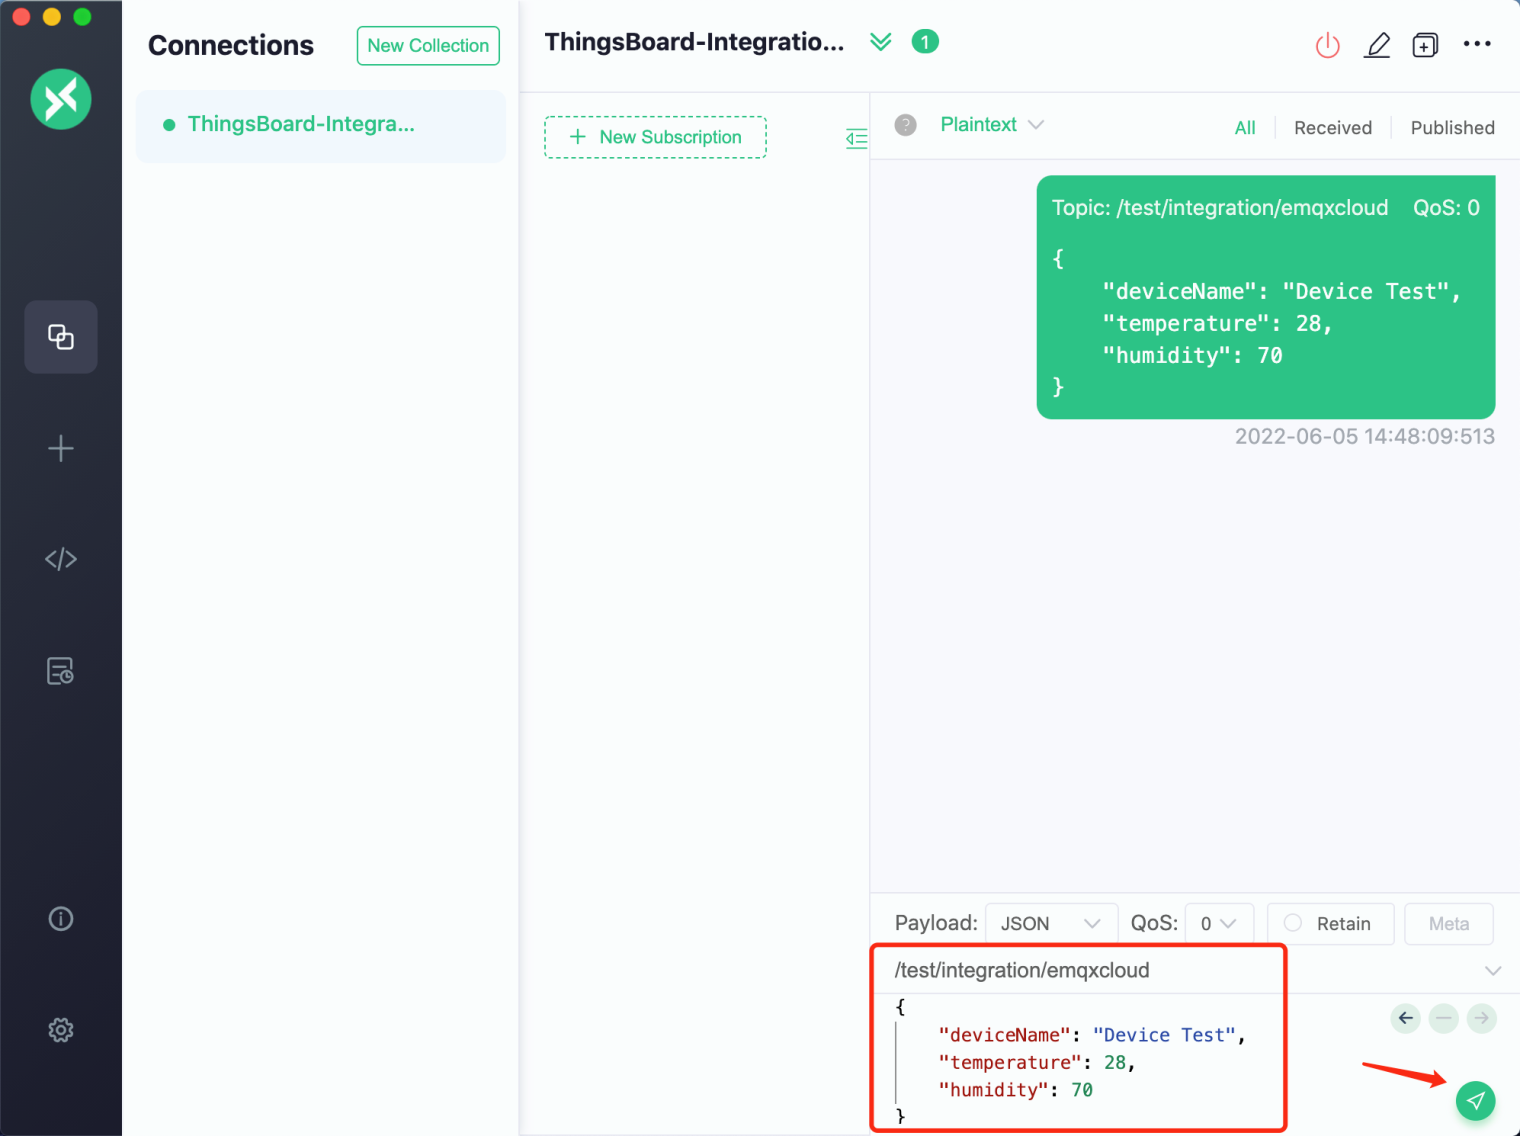
- After the connection is successfully established, simulate a device by sending temperature and humidity data to the filter topic /test/integration/emqxcloud, which was configured during the integration above.
{
  "deviceName": "Device Test",
  "temperature": 28,
  "humidity": 70,
}
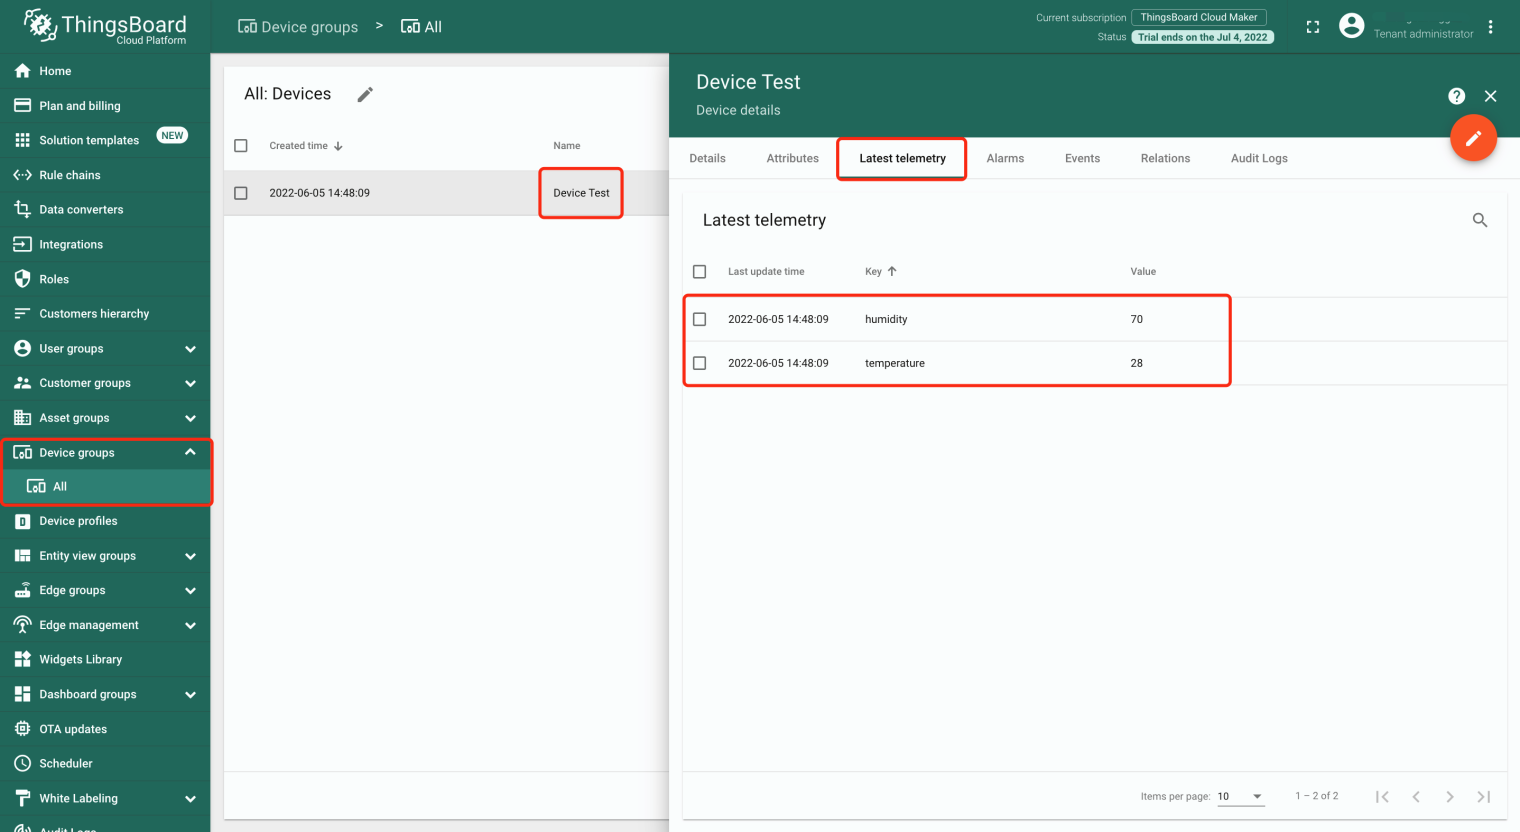
- In Thingsboard, go to the [All] menu under [Device groups] to view the device name, and temperature and humidity data that were just simulated. This means that the EMQX Cloud deployment has been successfully integrated.
Customizing Dashboard to access the MQTT data
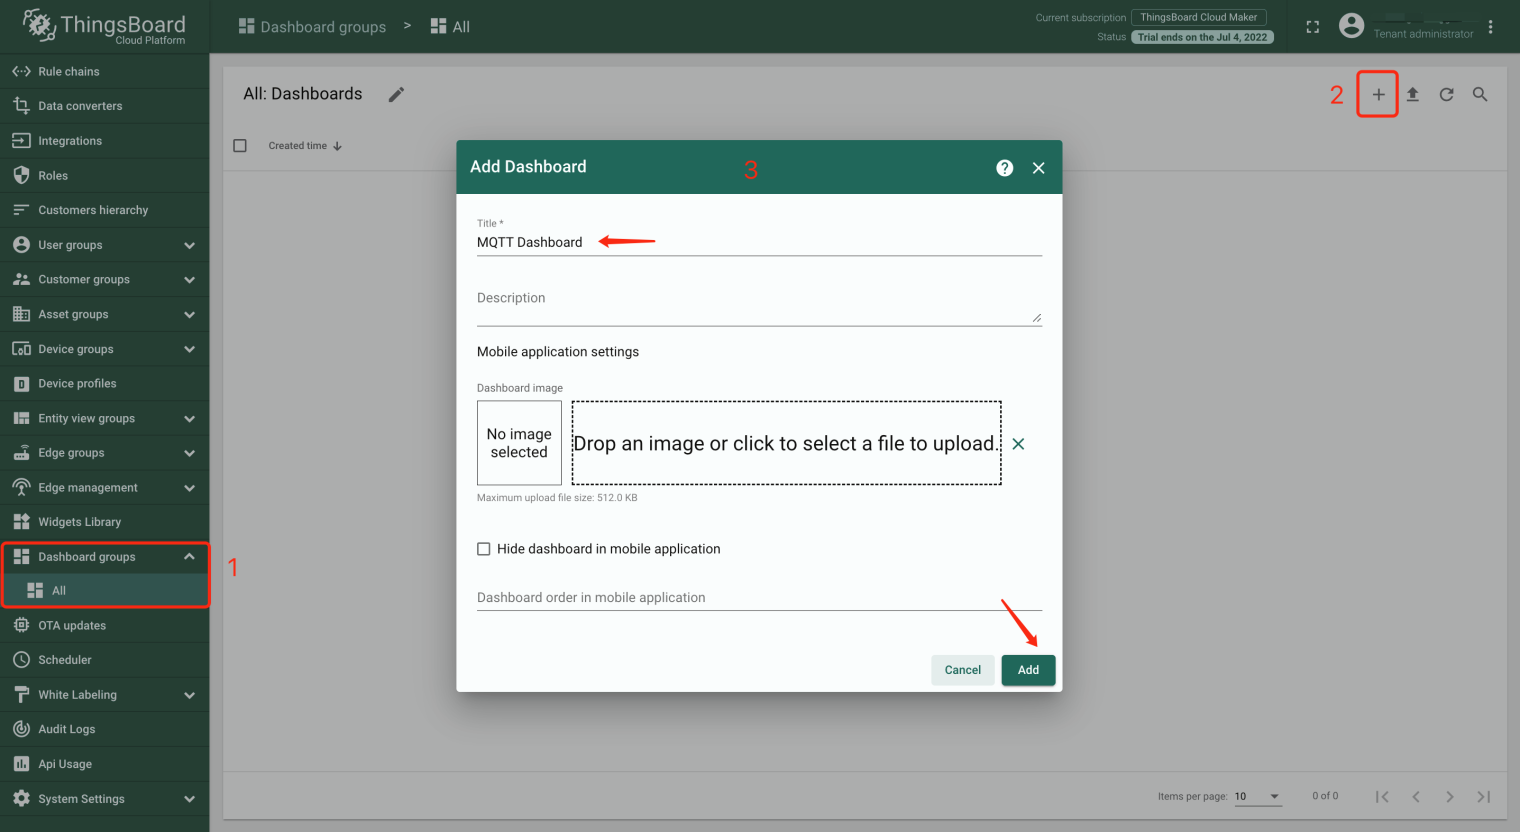
- Click on the [Dashboard groups] menu, select [All] and click [+] to Add a new dashboard. Give it a name and click Add.
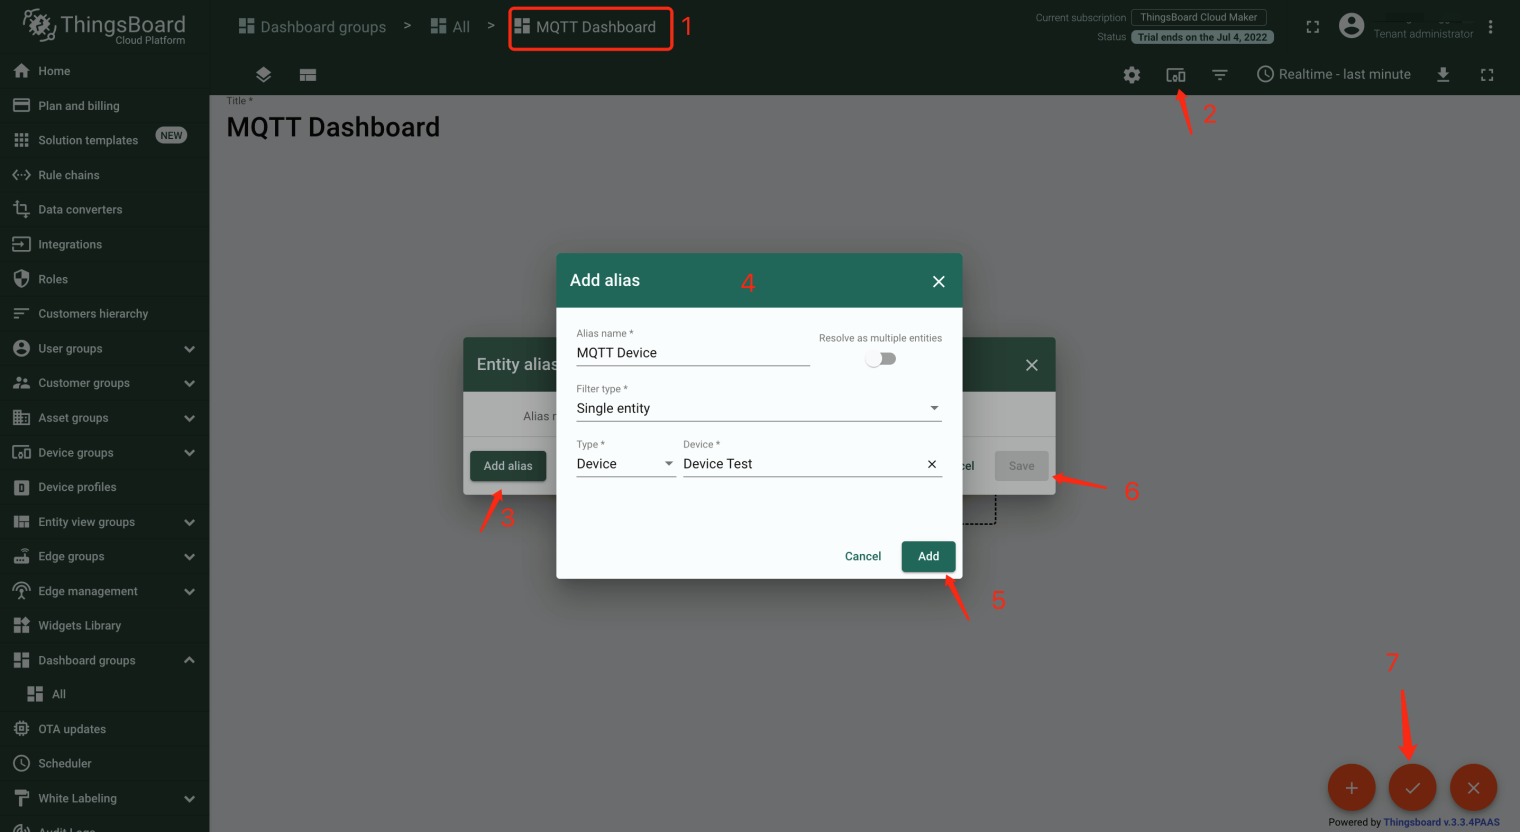
- Open the Dashboard and click the orange edit icon in the bottom right corner. Then, follow the instructions in the figure to add an alias (define the data that will be used for the entity). Select “Single Entity” for Filter Type, “Device” for Type and select the Device Test device simulated by MQTT X above. After adding and saving all the configuration information, click the Apply icon in the bottom right corner.
- Add a time series widget.
a. Similar to the previous page, click the orange edit icon in the bottom right corner to enter edit mode, and click Add widget.
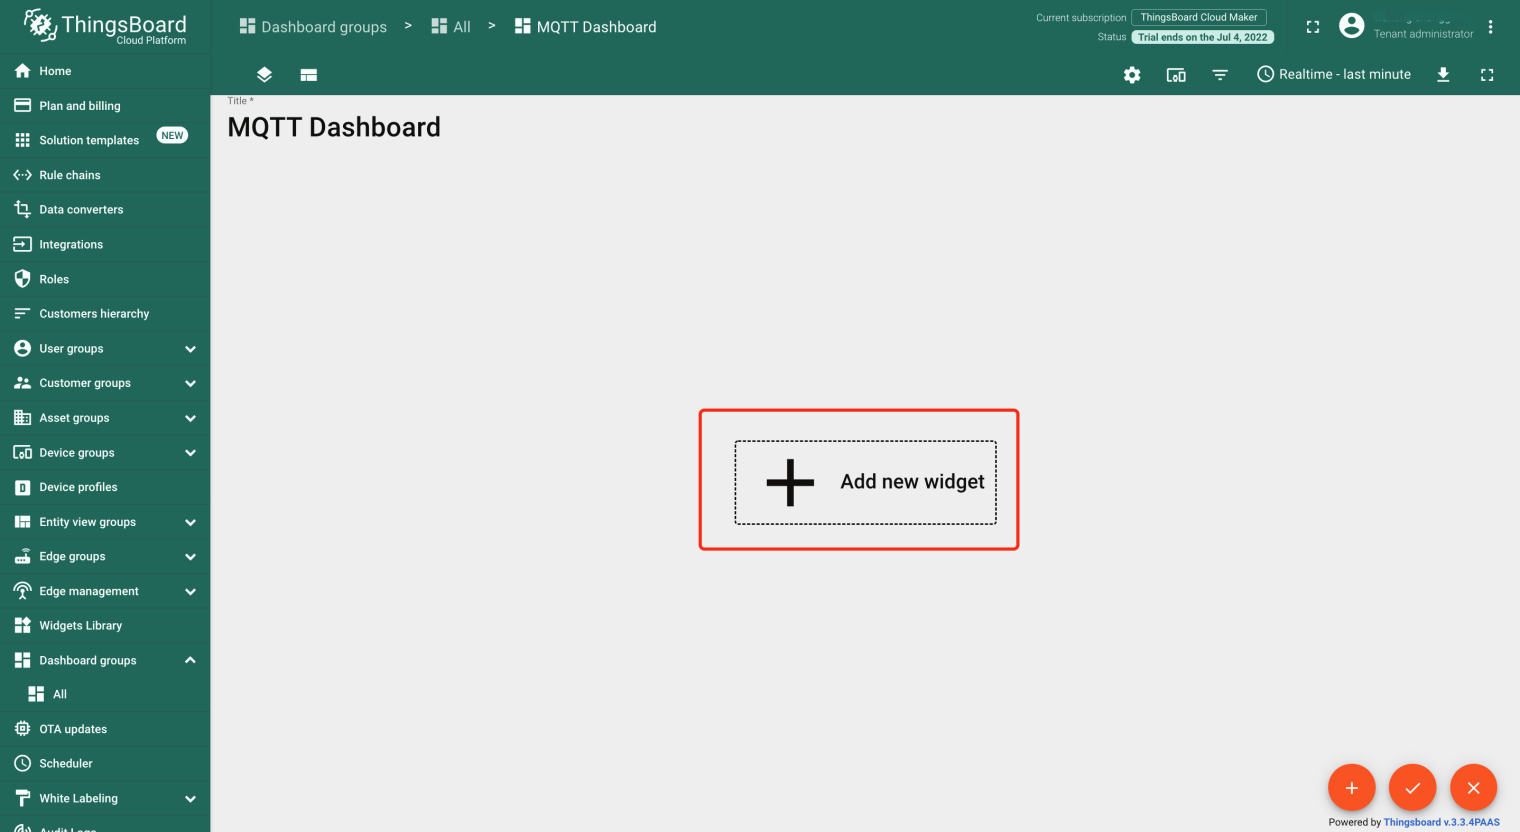
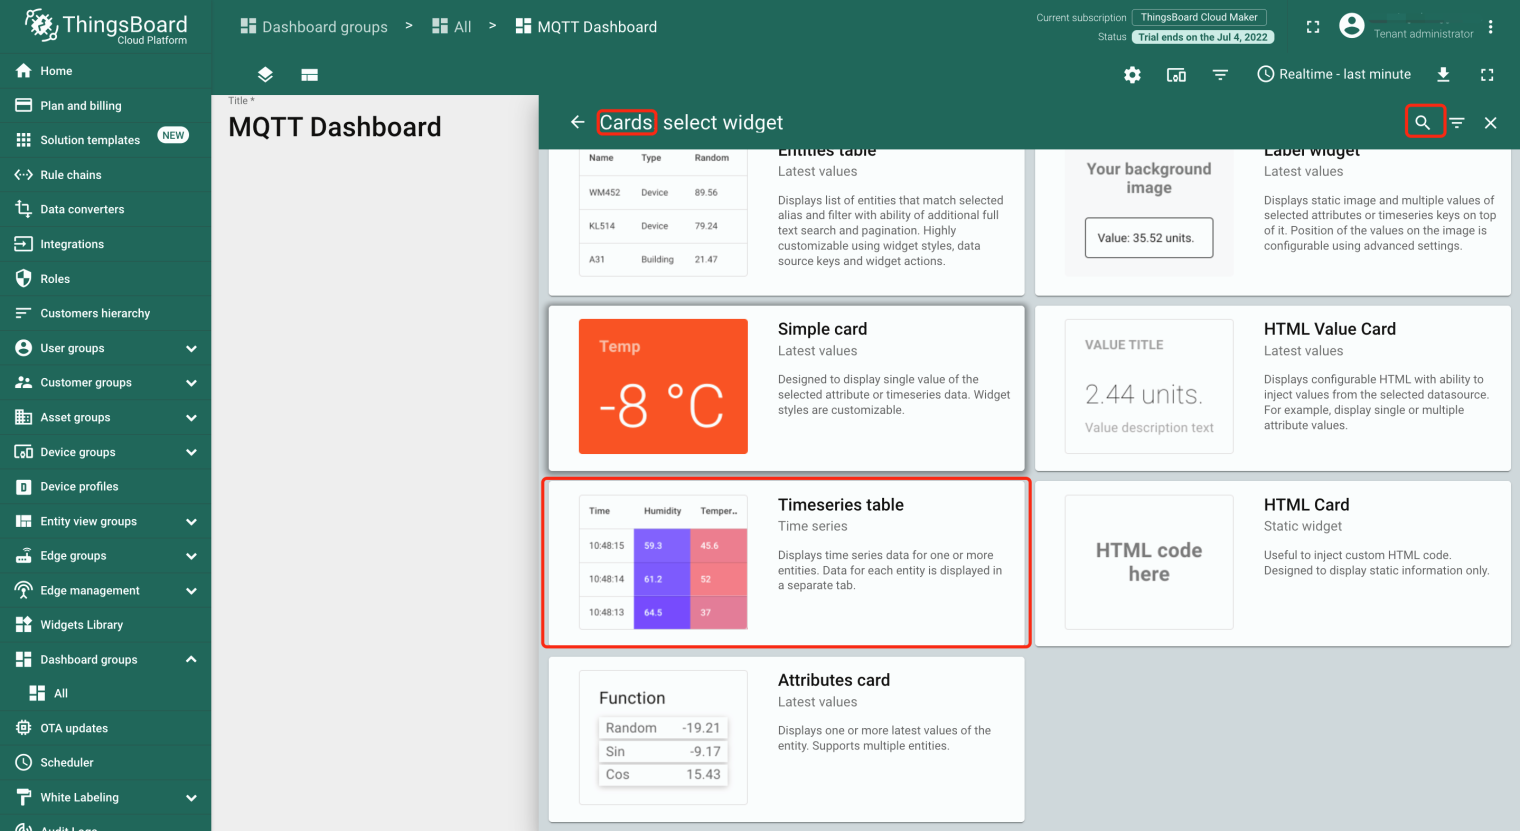
b. Enter Cards to search for the Timeseries table and click Configure.
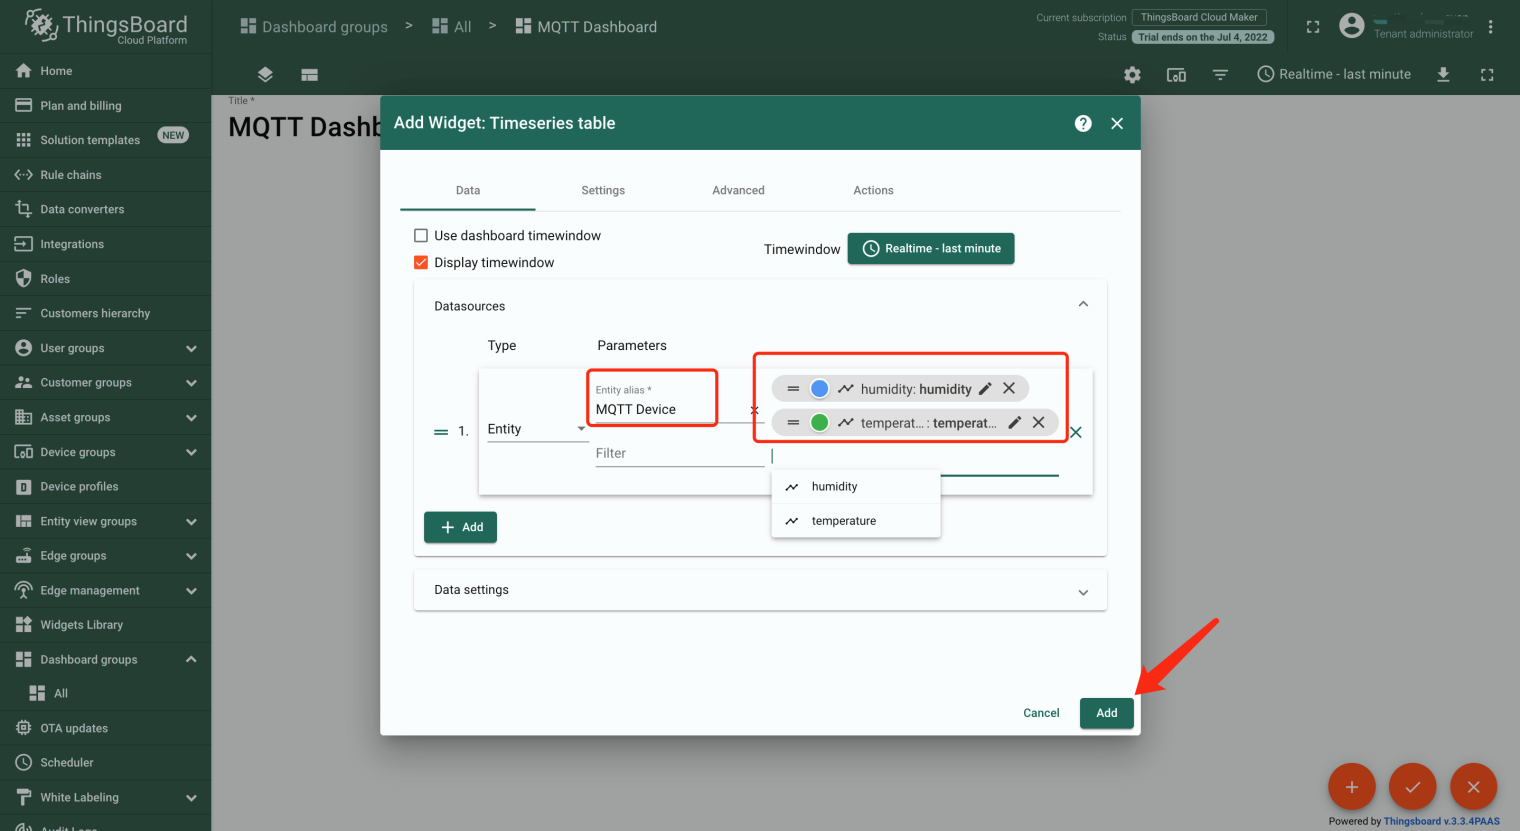
c. Configure the selected table. Choose the alias that was set above for the entity alias, add the key values of the table, and finally, click the Add button.
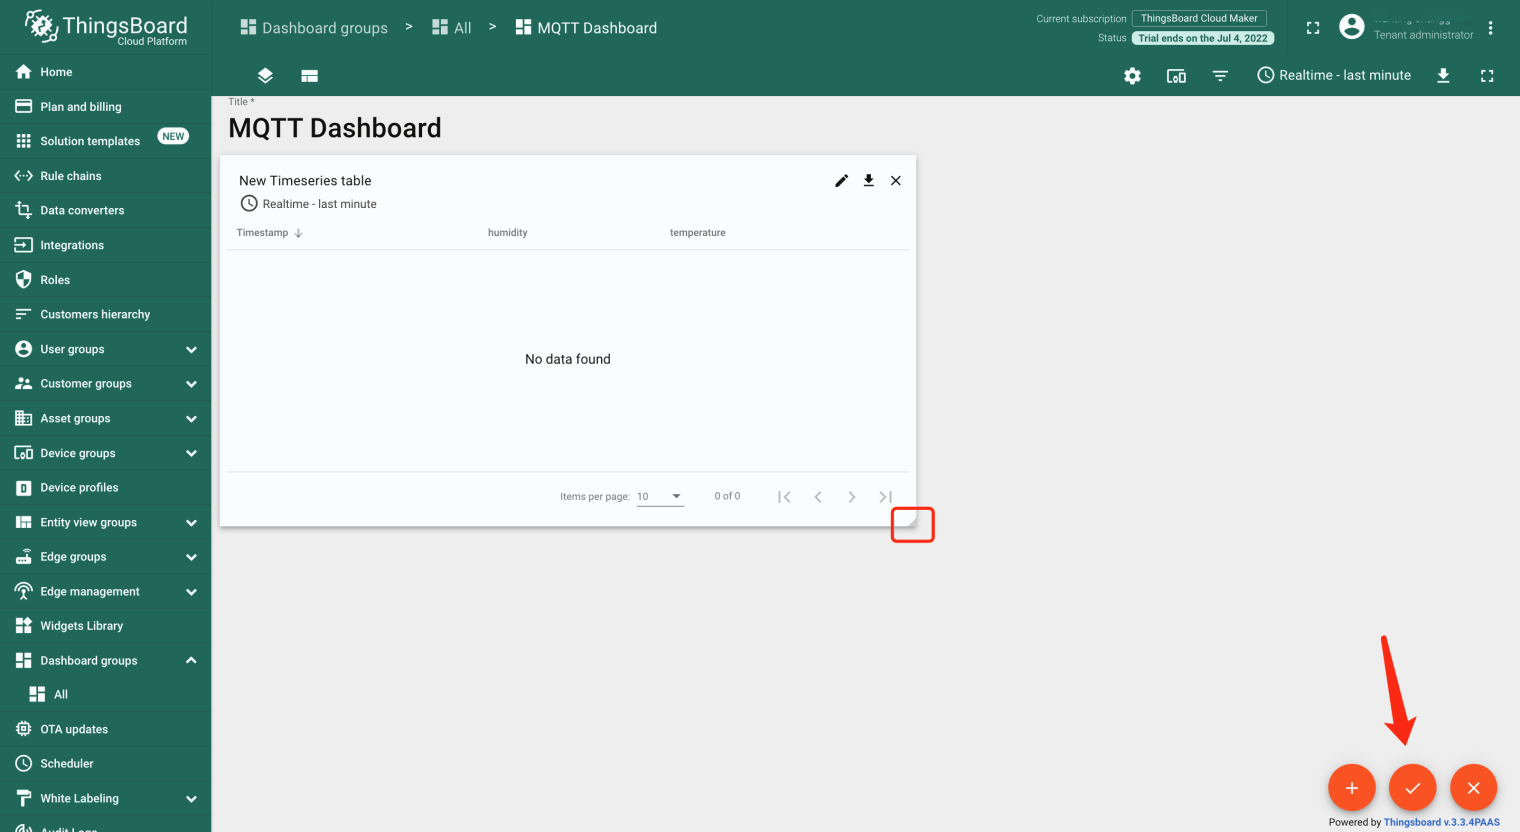
d. Drag and drop to resize the table that was just added, and click the orange checkmark Apply button.
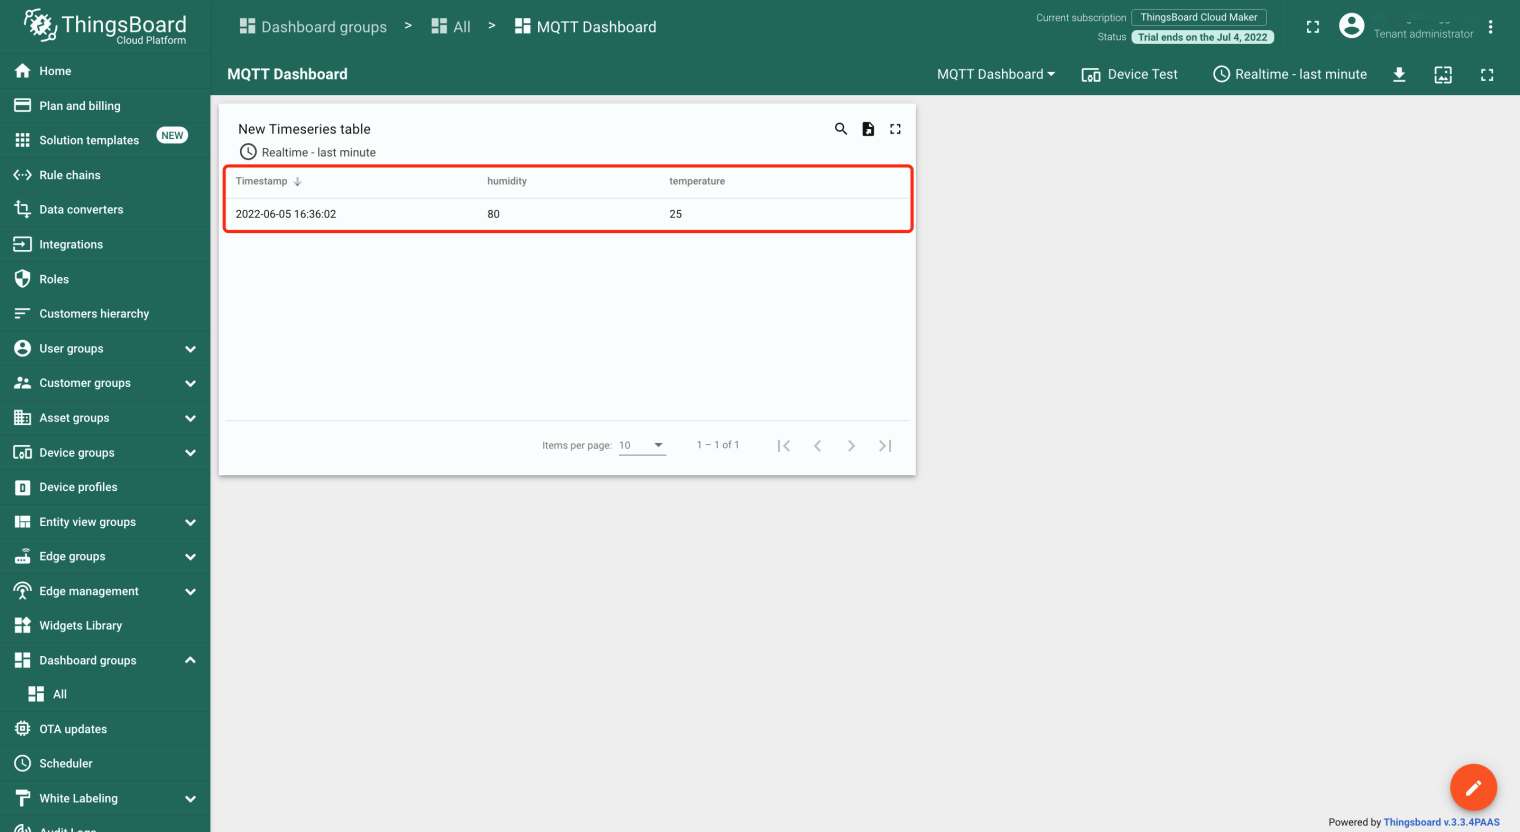
e. Go back to MQTT X, change the temperature value to 25 and humidity value to 80, publish a message again, and the corresponding data will be displayed in the table that was just configured.
- Similar to step 3 above, click Add a widget, search for charts, select Timeseries Line Chart, configure this, click Apply, and change the live time range to the last 5 hours. Using MQTT X, send another set of data, and the corresponding data will be displayed in both components.
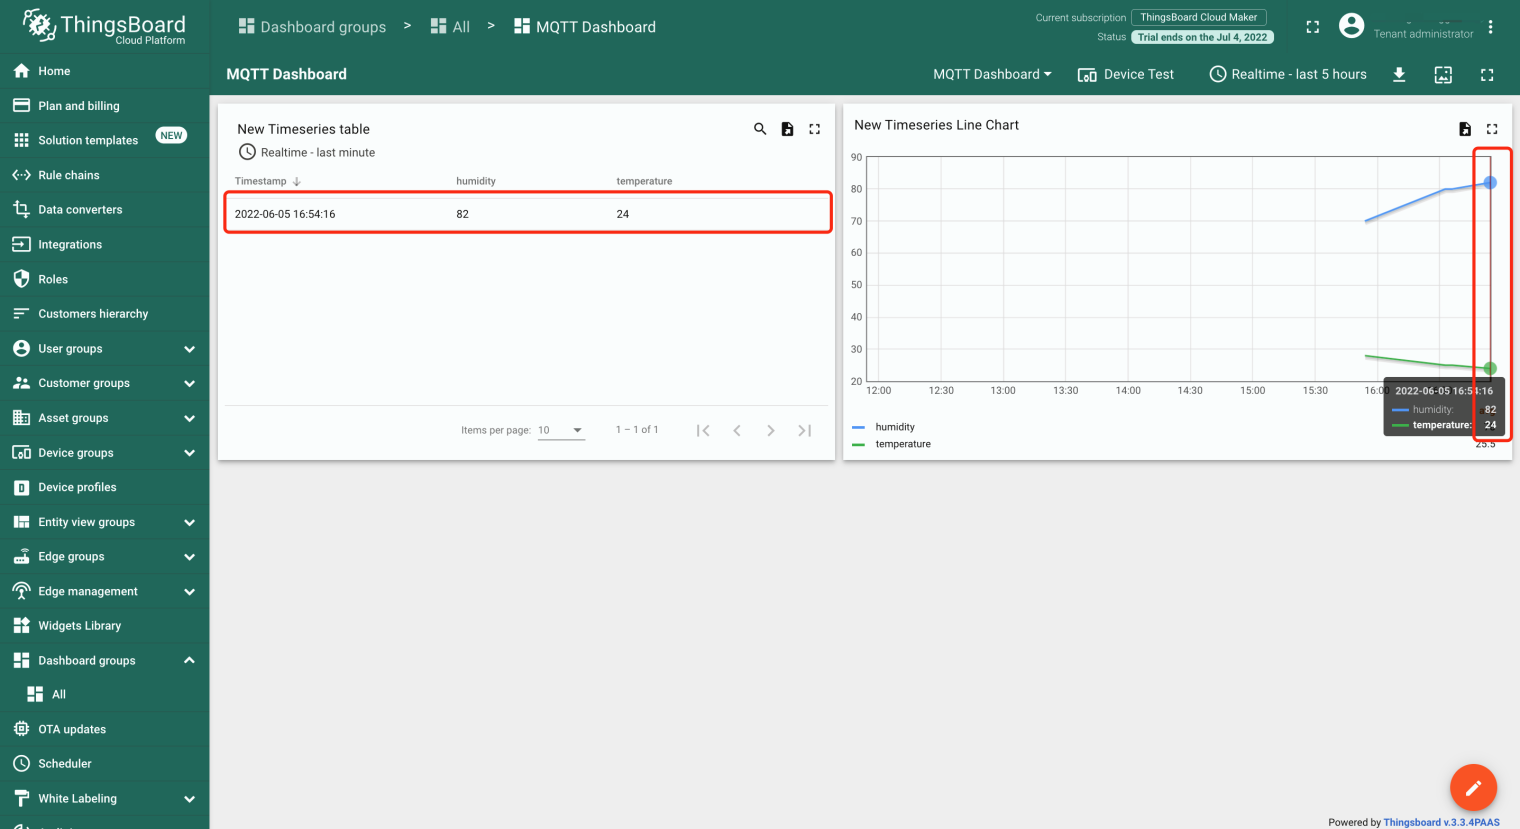
At this point, we have finished integrating the EMQX Cloud deployment in ThingsBoard Cloud, verified the integration functionality using MQTT X tests, and finally configured a simple Dashboard to display the MQTT data. In real projects, more complex Dashboard configurations can be performed after learning more about ThingsBoard. This will allow you to visually monitor device-related data in real-time detail and set alert thresholds to help you resolve issues in a timely manner.
Originally published at https://www.emqx.com.
