Understanding and Addressing Memory Leaks in Unity Game Development
Understanding Memory Leaks and Their Hazards
While many programmers have likely encountered the term "memory leak," it might not be as familiar to beginners. You might be wondering, does a memory leak mean that memory is physically leaking out? Let's clarify the concept with a definition from Wikipedia:

After reading the detailed definition, it might seem a bit complex. Let's use a simple analogy to make it more understandable.
Think of memory leaks as "borrowing money from a bank and not paying it back." In the digital world of computers, the operating system acts as the bank, each loan represents a memory request, and you are the application. In other words, borrowing money from the bank is equivalent to an application requesting memory from the operating system. Thankfully, in the world of computers, the operating system is a generous bank that doesn't charge interest; you only need to return the exact amount of memory you borrowed. So, we can simplify the definition of a memory leak as requesting memory but not releasing it when it should be released.
If you continuously borrow money and don't pay it back, the bank will eventually run out of funds for others to borrow. In real life, banks prevent this by blacklisting individuals who consistently fail to repay loans, refusing to lend them any more money. The operating system is even more unforgiving; it will forcefully shut down the application. This demonstrates the dangers and severity of memory leaks. If left unchecked, the application may crash due to excessive memory usage. Additionally, there are other risks associated with memory leaks, such as memory being occupied by useless objects, leading to increased time costs for subsequent memory allocation, causing game lag, and more.
Memory Leaks in Unity
Let's delve into memory leaks within a specific environment - Unity. As we know, game programs consist of code and resources. Memory leaks in Unity can be primarily divided into code-side leaks and resource-side leaks. Of course, resource-side leaks are also caused by unreasonable references to resources in the code.
Code-side leaks - Mono memory leaks
Those familiar with Unity should know that Unity uses Mono-based C# (as well as other scripting languages, but they seem to be used less frequently, so we won't discuss them here) as its scripting language. It relies on the Garbage Collection (GC) mechanism for memory management. Since memory is managed, why are there still memory leaks? It's because GC itself is not all-powerful. What GC can do is find "garbage" through specific algorithms and automatically reclaim the memory occupied by the "garbage." So, what is garbage?
First, let's take a look at the description of GC implementation on Wikipedia:

In simpler terms, let's think about garbage in our daily lives. We usually consider things with no value as "garbage," and in the world of garbage collection (GC) in programming, it's the same - objects with no references are considered "garbage." When there are no references, it means that the object has no value, making it "garbage." The GC mechanism reclaims the memory occupied by these objects.
Understanding this concept helps explain why memory leaks still occur in managed memory environments. It's like when someone forgets to throw away an empty instant noodle box after eating - in a computer's perspective, this means that we "forget" to clear the reference to an object that's no longer needed.
You might wonder if small memory allocations in your code would have a significant impact on devices with large memory. Keep in mind that memory allocation happens not only when you explicitly call "new" but also through many implicit allocations, like creating a list, caching configurations, or generating a string. If multiple people allocate memory, it adds up quickly.
It's also important to know that in the Unity environment, the memory usage of the Mono heap only increases and doesn't decrease. The Mono heap is like a memory pool, and each time memory is requested, it's allocated within the pool. When memory is released, it's returned to the pool but not the operating system. If there's not enough memory in the pool, it expands by requesting more memory from the operating system. Each expansion is a large memory allocation, increasing the pool by approximately 6-10MB (based on observation, not official data).

The image mentioned above displays the results of a Cube test for a specific game, showing that the Mono heap (represented by the black line) has reached over 70MB. This highlights the importance of addressing Mono memory leaks in Unity game development.
Resource leaks - Native memory leaks
Resource leaks refer to situations where memory is occupied after loading resources, but the resources aren't unloaded when they're no longer needed, leading to unnecessary memory usage.
Before discussing the causes of resource memory leaks, let's first examine Unity's resource management and recycling methods. Resource memory and code memory are discussed separately because their memory management methods differ.
The memory allocated by the code mentioned earlier is allocated through the Mono virtual machine on the Mono heap memory, which generally has a smaller memory footprint and is mainly used by programmers when handling program logic. In contrast, Unity's resources are allocated through Unity's C++ layer on the Native heap memory. For example, memory allocated through interfaces in the UnityEngine namespace will be allocated on the Native heap by Unity, while memory allocated through interfaces in the System namespace will be allocated on the Mono heap by the Mono Runtime.

Now that we understand the differences in allocation and management methods, let's examine the recycling methods. As mentioned earlier, Mono memory is recycled through garbage collection (GC), and Unity also provides a similar method for memory recycling. The difference is that Unity's memory recycling needs to be actively triggered. For example, if we throw garbage in the trash can, GC checks it daily and takes away any garbage; with Unity, however, you need to call and notify it to collect the garbage. The interface to actively call is Resources.UnloadUnusedAssets(). GC also provides a similar interface, GC.Collect(), to actively trigger garbage collection. Both interfaces require a large amount of computation, and it's not recommended to actively call them during gameplay. To avoid game stuttering, it's generally recommended to handle garbage collection during the loading process. Note that Resources.UnloadUnusedAssets() itself will call GC.Collect(). Unity also offers a more aggressive method - Resources.UnloadAssets() to unload resources, but this interface will directly delete resources regardless of whether they are "garbage" or not, making it a risky interface. It's recommended to call this interface only when you're sure the resources aren't being used.
With this knowledge, let's explore why resource leaks occur. First, like code-side leaks, resource leaks can happen due to "existing references that should be released but aren't." The recycling mechanism considers the target object not to be "garbage," making it unable to be recycled. This is the most common situation.
For resources, there's another typical leak scenario. Since resource unloading is actively triggered, the timing of clearing resource references becomes crucial. As game logic becomes more complex and new members join the project team, they may not necessarily understand all the details of resource management. If references to resources are cleared "after triggering resource unloading," memory leaks can also occur.
There is another type of resource leak caused by certain Unity interfaces that generate a copy when called. If not used carefully, this can result in numerous resource copies during runtime, leading to unnecessary memory waste. However, such memory copies are generally small in quantity and relatively easy to fix, so they will not be discussed in detail here.
Fixing Memory Leaks
As mentioned earlier, to avoid memory leaks, we need to break the reference before the garbage collection occurs, which may seem like a simple problem. However, due to the complexity of real-world projects, the reference relationship is not just one or two layers (sometimes even up to dozens of layers connecting to the final reference object), and there may be complex situations such as cross-references and circular references. It is challenging to correctly break the reference just from a code review perspective. Finding the leaking reference is the key and difficult point in fixing the leak, and it is also the main focus of this article. As for timing issues, they are relatively simple and will not be discussed here.
New Memory Profiler for Unity 5
Unity's Memory Profiler has often been criticized by users for not providing a clear reflection of memory usage and who is using it. As the latest generation of Unity products, Unity5 has addressed this weakness by introducing a new generation of memory analysis tools that better solve the aforementioned problems. However, it does not provide a comparison function for two (or more) memory snapshots, which is a bit disappointing.
Note: Memory snapshot comparison is a common method for finding memory leaks. By capturing the state of memory at two different times and comparing them, it is possible to see the changes in memory and find the increment and leak points. Typically, two dumps are done before entering and after exiting a game level, and any additional memory allocations can be considered leaks.
Since it is an official Unity tool, there are detailed tutorials available online, so there is no need to go into detail here.
As Unity 5's popularity and stability still need improvement, most companies continue to use the 4.x environment. In this case, the new tool mentioned above is not applicable. Some might suggest upgrading a Unity5 project for Memory Profiling, which is possible, but Unity5 is not very compatible with Unity4. A lot of modifications are required during the upgrade process, and maintaining two projects can be quite troublesome.
So, here are two leak-tracking tools that can also be used in the Unity4 environment.
Magnifying Glass for Mono Memory - PerfDog
PerfDog is a comprehensive mobile platform performance testing and analysis tool on Tencent's WeTest platform under Tencent Games, aiming to improve the performance and quality of applications and games.
PerfDogService can be used on Windows, Mac, and Linux platforms. The customized and integrated data panels with internal quality platforms are displayed on the web. Users develop their tools and build performance monitoring locally. Services such as automation and cloud testing are provided.
Tracing Back the Vine - Finding Resource References in Mono
Before attempting to find resource references and fix resource leaks, we need to understand how to locate resource leaks in Unity.
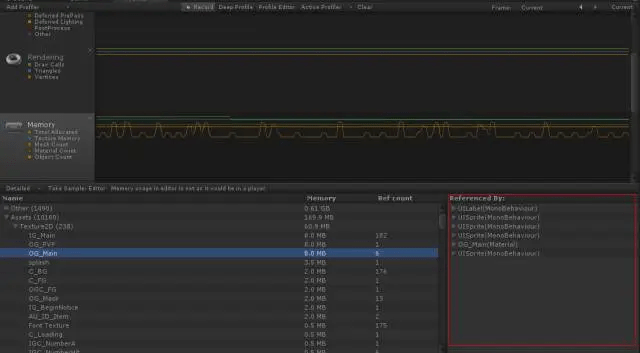
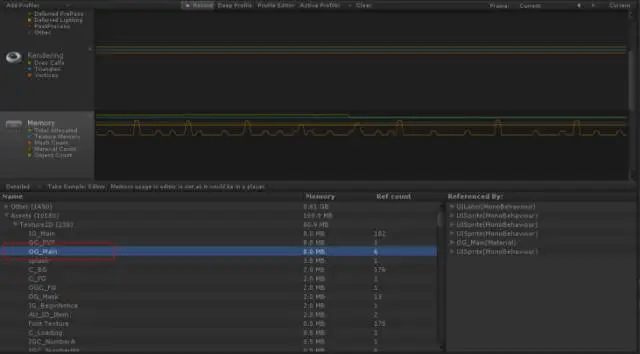
We need to use Unity's built-in Memory Profiler (note that this is not the new Profiler mentioned earlier for Unity5, but the older, less capable version). Here's a simple example: run the game project in the Unity editor environment, go through the "Lobby" page, and enter the "Single Round." Now open the Unity Profiler, switch to Memory, and perform a memory sampling. In the sampling results (which include all resources in memory at the time of sampling), expand Assets->Texture2D. If you can see the texture used by the "Lobby" UI (as shown below), we can consider this UI texture as a resource leak.

Why is this considered a resource leak? Because this UI texture was requested during the "Lobby" stage, but it is no longer needed in the "Single Round" stage, yet it is still in memory. This kind of memory usage that exists when it is not needed is what we defined as a memory leak earlier.
So, how do we find these leaking resources in our everyday projects?
The most intuitive method, which is also the most straightforward method, is to perform a memory sampling every time the game state changes and check each resource in memory one by one to determine if it is genuinely needed for the current game state. The biggest problem with this method is that it is time-consuming and labor-intensive, and with too many resources, it is easy to miss something.
Here are two clever methods:
-
Identifying by resource name. That is, when naming art resources (such as textures, and materials), include the game state they belong to in the file name. For example, if a texture is called BG.png and is used in the lobby, rename it to OG_BG.png (OG = OutGame). This way, it is easy to identify when an OG resource is mixed in with a bunch of IG (IG = InGame) resources, and it is also convenient for program recognition. This method also has the added benefit of reinforcing artists' understanding of the resource lifecycle, and providing guidance when creating resources, especially when planning UI atlases.
-
Use Unity's Resources.UnloadUnusedAssets() interface to dump resources. You can dump textures, materials, models, or other resource types as needed by passing the Type as a parameter. After a successful dump, save the results as a text file. This way, you can use Beyond Compare to compare the results of multiple dumps and find the added resources. These resources are potential leak objects that need to be investigated.
Combining the methods and ideas mentioned above, you should be able to find the leaking resources easily.
Now let's take a look back at the Unity Profiler. Unity provides a resource index search function, but it is presented as a tree-structured text (as shown below). As mentioned earlier, the internal reference relationship in Unity is often very complex, and it may take dozens of references to find the final referrer. Moreover, the reference relationships are intricate, forming a vast graph. At this point, it is nearly impossible to find the reference just by expanding the tree structure.

Preventing Memory Leaks
Having discussed how to fix memory leaks, I'd like to go a step further and say that as long as we think more during our daily development process and nip problems in the bud, memory leaks can be entirely avoided. Compared to waiting for leaks to occur and then tracing them back, spending more time cleaning up "garbage" in daily development is a more efficient approach.
Here are a few suggestions to apply to the daily development process, and I welcome any additional input from experts:
-
In the architecture, add more destructors as abstract interfaces to remind team members to pay attention to cleaning up the "garbage" they generate.
-
Strictly control the use of static, and prohibit the use of static in non-essential situations.
-
Reinforce the concept of the lifecycle, whether it's code objects or resources, they all have their lifecycle and should be released once the lifecycle ends. If possible, describe the lifecycle in the functional design documentation.
As qualified programmers, we should also be able to handle the "garbage" in our code and not let our games become a "garbage dump."
To avoid the negative impact of mobile game performance issues mentioned above, Tencent's WeTest platform's PerfDog tool can help developers discover the resource usage situation within the game, assisting in continuously improving the player experience during game development.
For more information, contact WeTest team at → WeTest-All Test in WeTest

Great article on understanding and addressing memory leaks in Unity game development! Memory management is crucial for maintaining performance and ensuring a smooth gaming experience. Your insights into identifying and fixing these leaks are invaluable for developers. In a similar vein, efficiency is key in gaming itself. As a World of Warcraft player, I’ve found that optimizing my time is essential. <a href=“https://wowvendor.com/shop/wow/dungeons/”>wow mythic plus carry</a> can help players focus on enjoying high-level content without getting bogged down by repetitive tasks, much like efficient memory management allows developers to focus on enhancing gameplay. Has anyone else found parallels between optimizing game development processes and optimizing gaming experiences?